Researchers at a university have developed a new map that tracks nearly every physical structure globally, from homes to remote sheds.
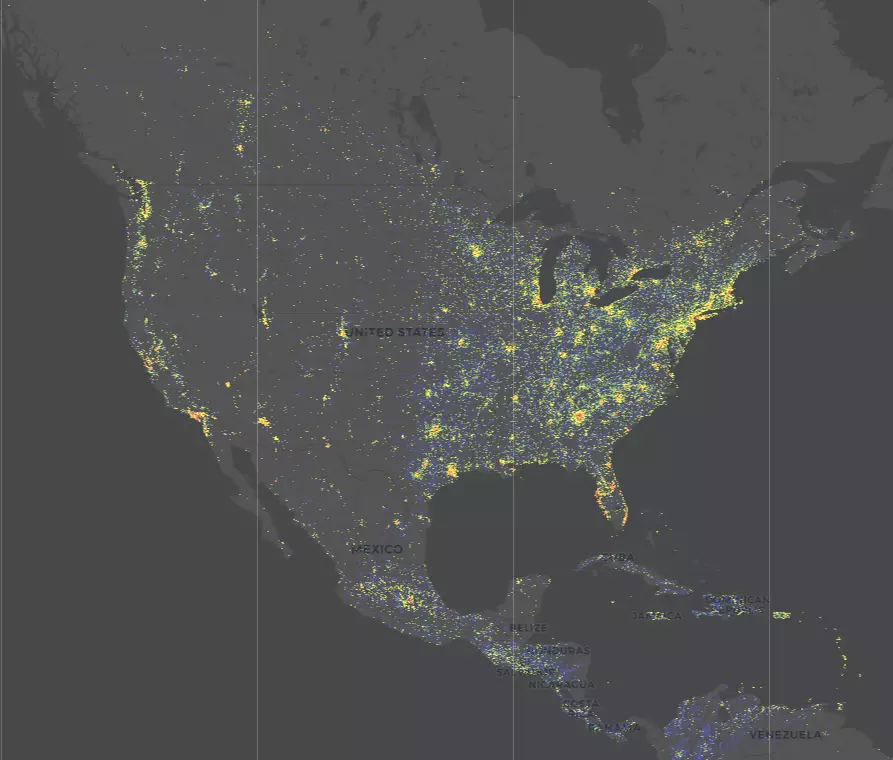
Scientists at the Technical University of Munich crafted this high-resolution map by employing AI machine learning techniques to analyze over 2.75 billion buildings.
Utilizing more than 800,000 satellite images from 2019, the German research team has, for the first time, documented how human structures have altered the planet’s landscape.
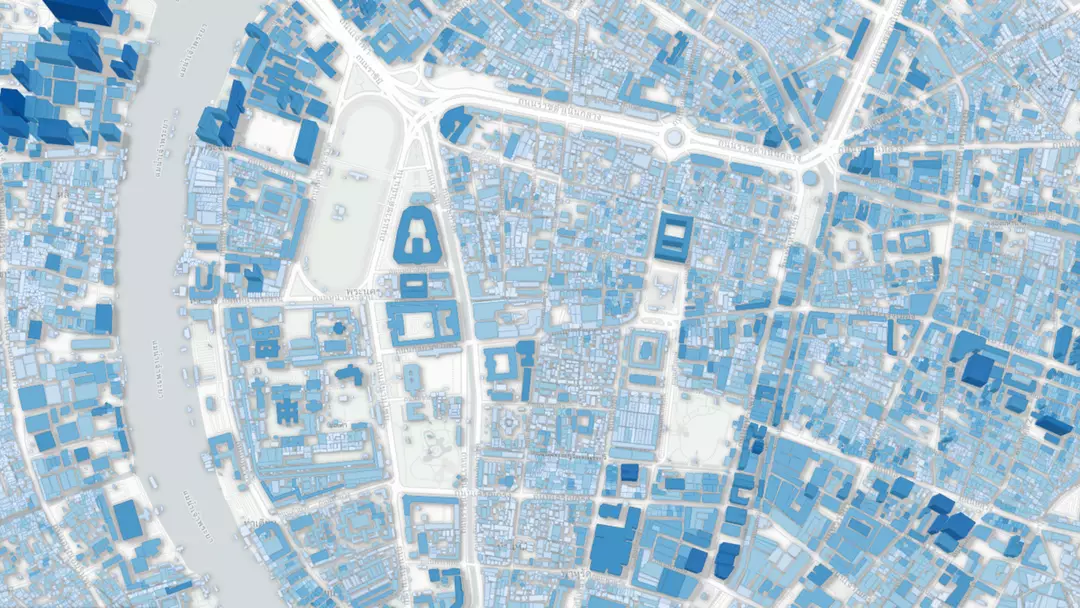
Named the GlobalBuildingAtlas, this innovative tool includes a billion more buildings than any other dataset available, offering 30 times more detail than existing 3D models.
This comprehensive information is intended to shape public policy by offering insights into human geography, economic disparity, and human impact on the planet’s remaining wild areas.

“With 3D models, we see not only the footprint but also the volume of each building, enabling far more precise insights into living conditions,” stated Professor Xiaoxiang Zhu, the lead author and project head of the study.
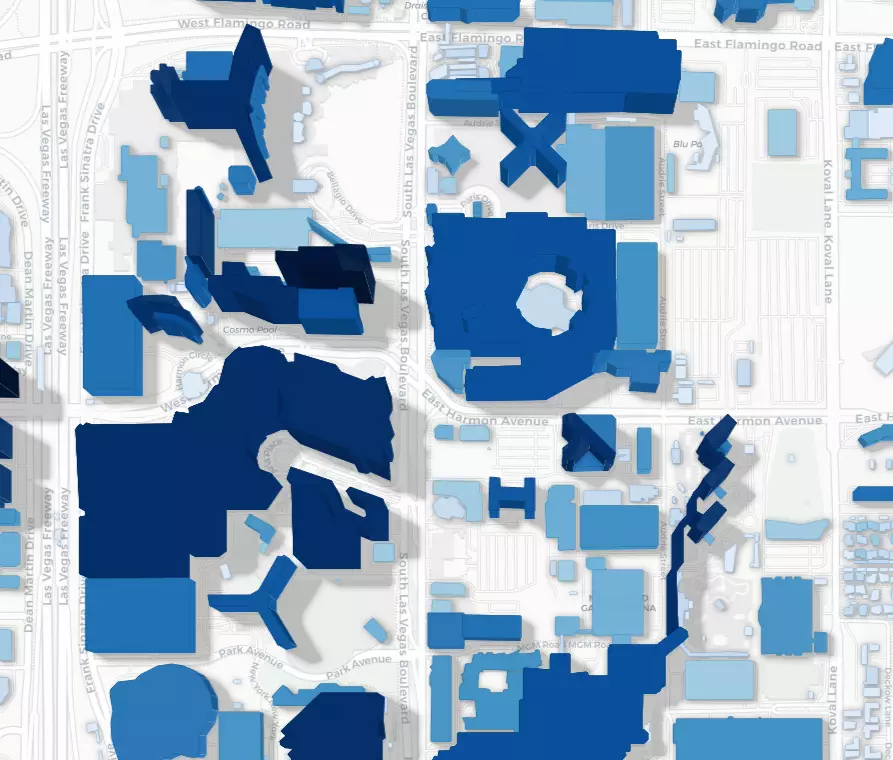
The AI-driven model assesses the height, volume, and proximity of each building, applicable in both rural and urban environments.
The purpose of this tool is to aid future researchers by providing comprehensive population-level insights into housing density, inequality, and climate change.
The creation of the map was a long-term endeavor, involving the integration of extensive mapping datasets and training the AI model to differentiate between the ground, structures, and other non-structural features like trees and roads.
One of its notable innovations is its ability to produce a highly accurate model using existing satellite data and machine learning techniques, eliminating the need for costly ground-scanning flights.
“3D building information provides a much more accurate picture of urbanization and poverty than traditional 2D maps,” Zhu explained.
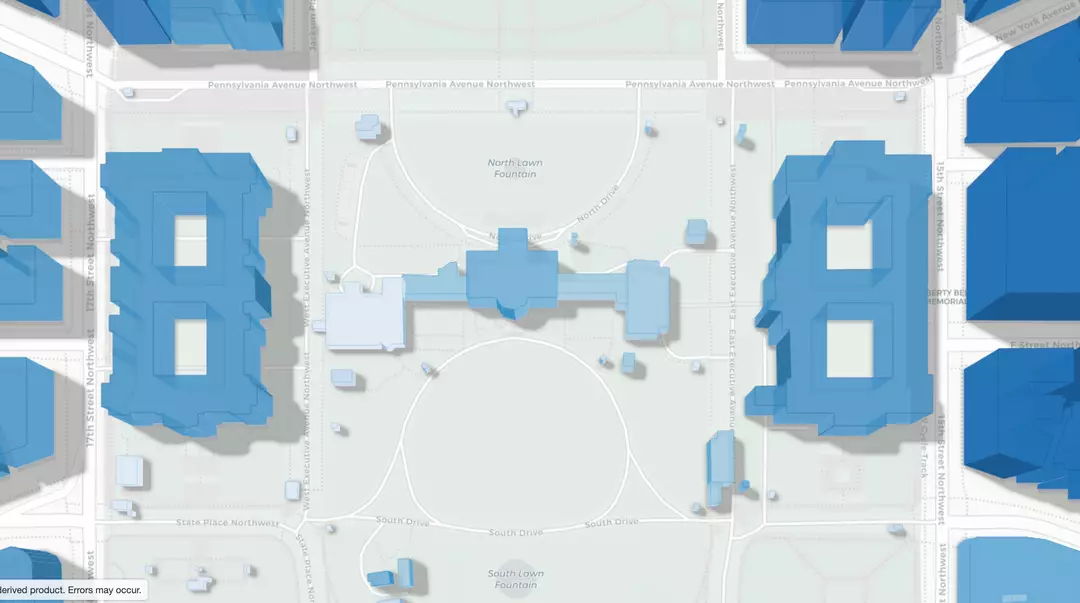
This model can even provide insights into the wealth of a region, as affluent areas generally have more space and a higher number of buildings per person compared to less prosperous areas.
The professor added: “With 3D models, we see not only the footprint but also the volume of each building, enabling far more precise insights into living conditions.
“We introduce a new global indicator: building volume per capita, the total building mass relative to population – a measure of housing and infrastructure that reveals social and economic disparities. This indicator supports sustainable urban development and helps cities become more inclusive and resilient.”
The researchers anticipate that their detailed global map will assist governments in strategic urban planning and in responding effectively to natural disasters such as floods and earthquakes.
Since its introduction, nearly 300,000 individuals have visited the Technical University of Munich’s website to explore the interactive buildings database.
You can explore the tool’s 3D model of your own residence here.